Plotting in Matlab is a very big topic. Here I just want to share some plotting functions I’ve been using to produce the maps.
If we have a 4*4 matrix and want to plot it as a 2d surface, two functions (pcolor and imagesc) can be considered. But these two functions yield different results:
create a matrix first:
A = hadamard(4);
A =
1  1  1  1
1 -1  1 -1
1  1 -1 -1
1 -1 -1  1
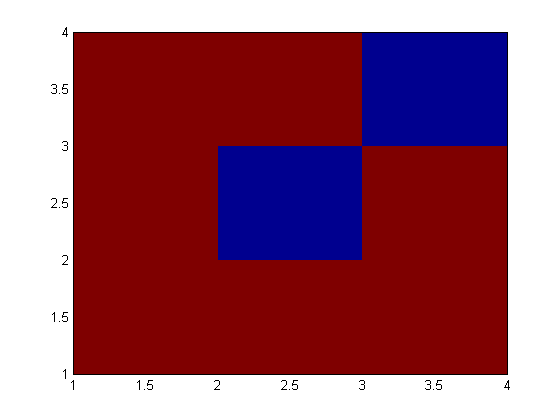
The pcolor (A) will cut the last column and row then flip upside down before plot. That’s because the first cell (1,1) is considered as origin point (0,0) at lower left. So the plot looks like this (red is 1, blue is -1):
But the imagesc (A) will give the as-is plot:

Loading comments...