Sample plotting scripts I normally use. Hope I could constantly update it.
Matlab
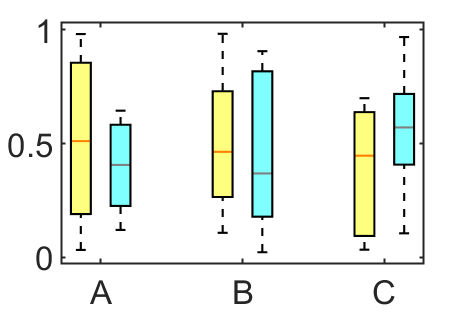 Grouped boxplots (script). Boxchart might be able to do the same for R2020a afterward. |
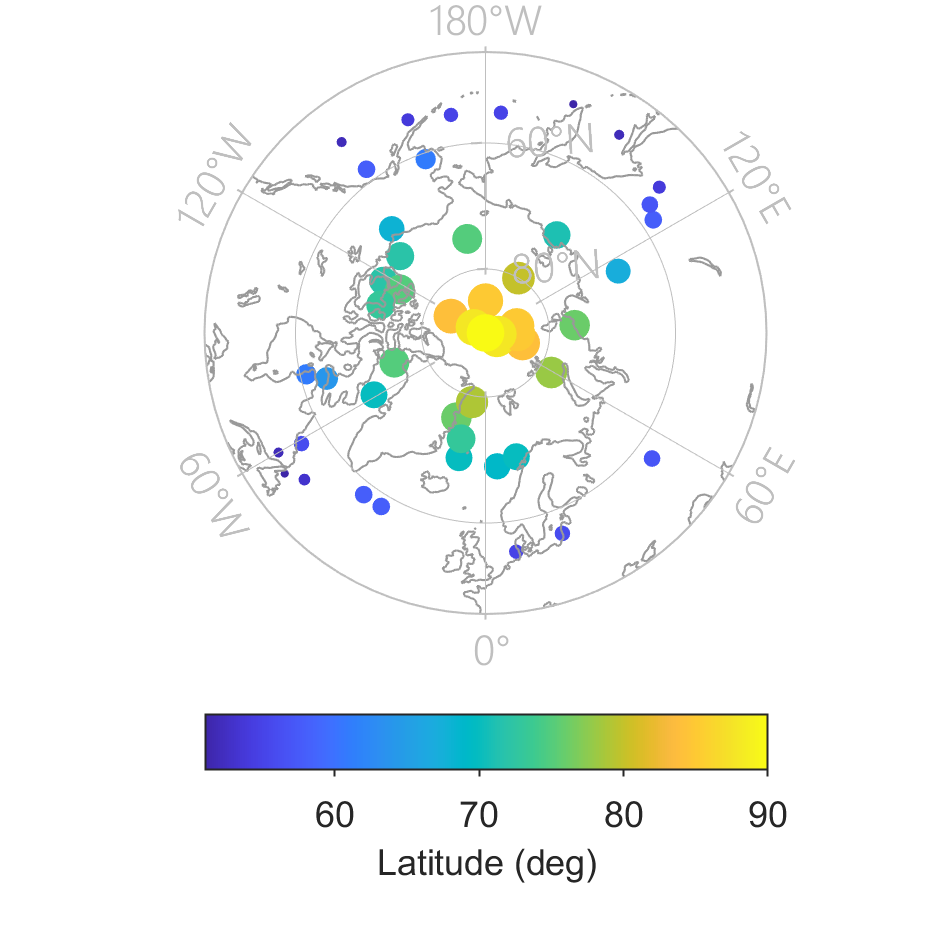 A scatter plot on a map with polar projection (script). The color and size are scaled to latitude of each dot. This plot requires the awesome M_Map package. |
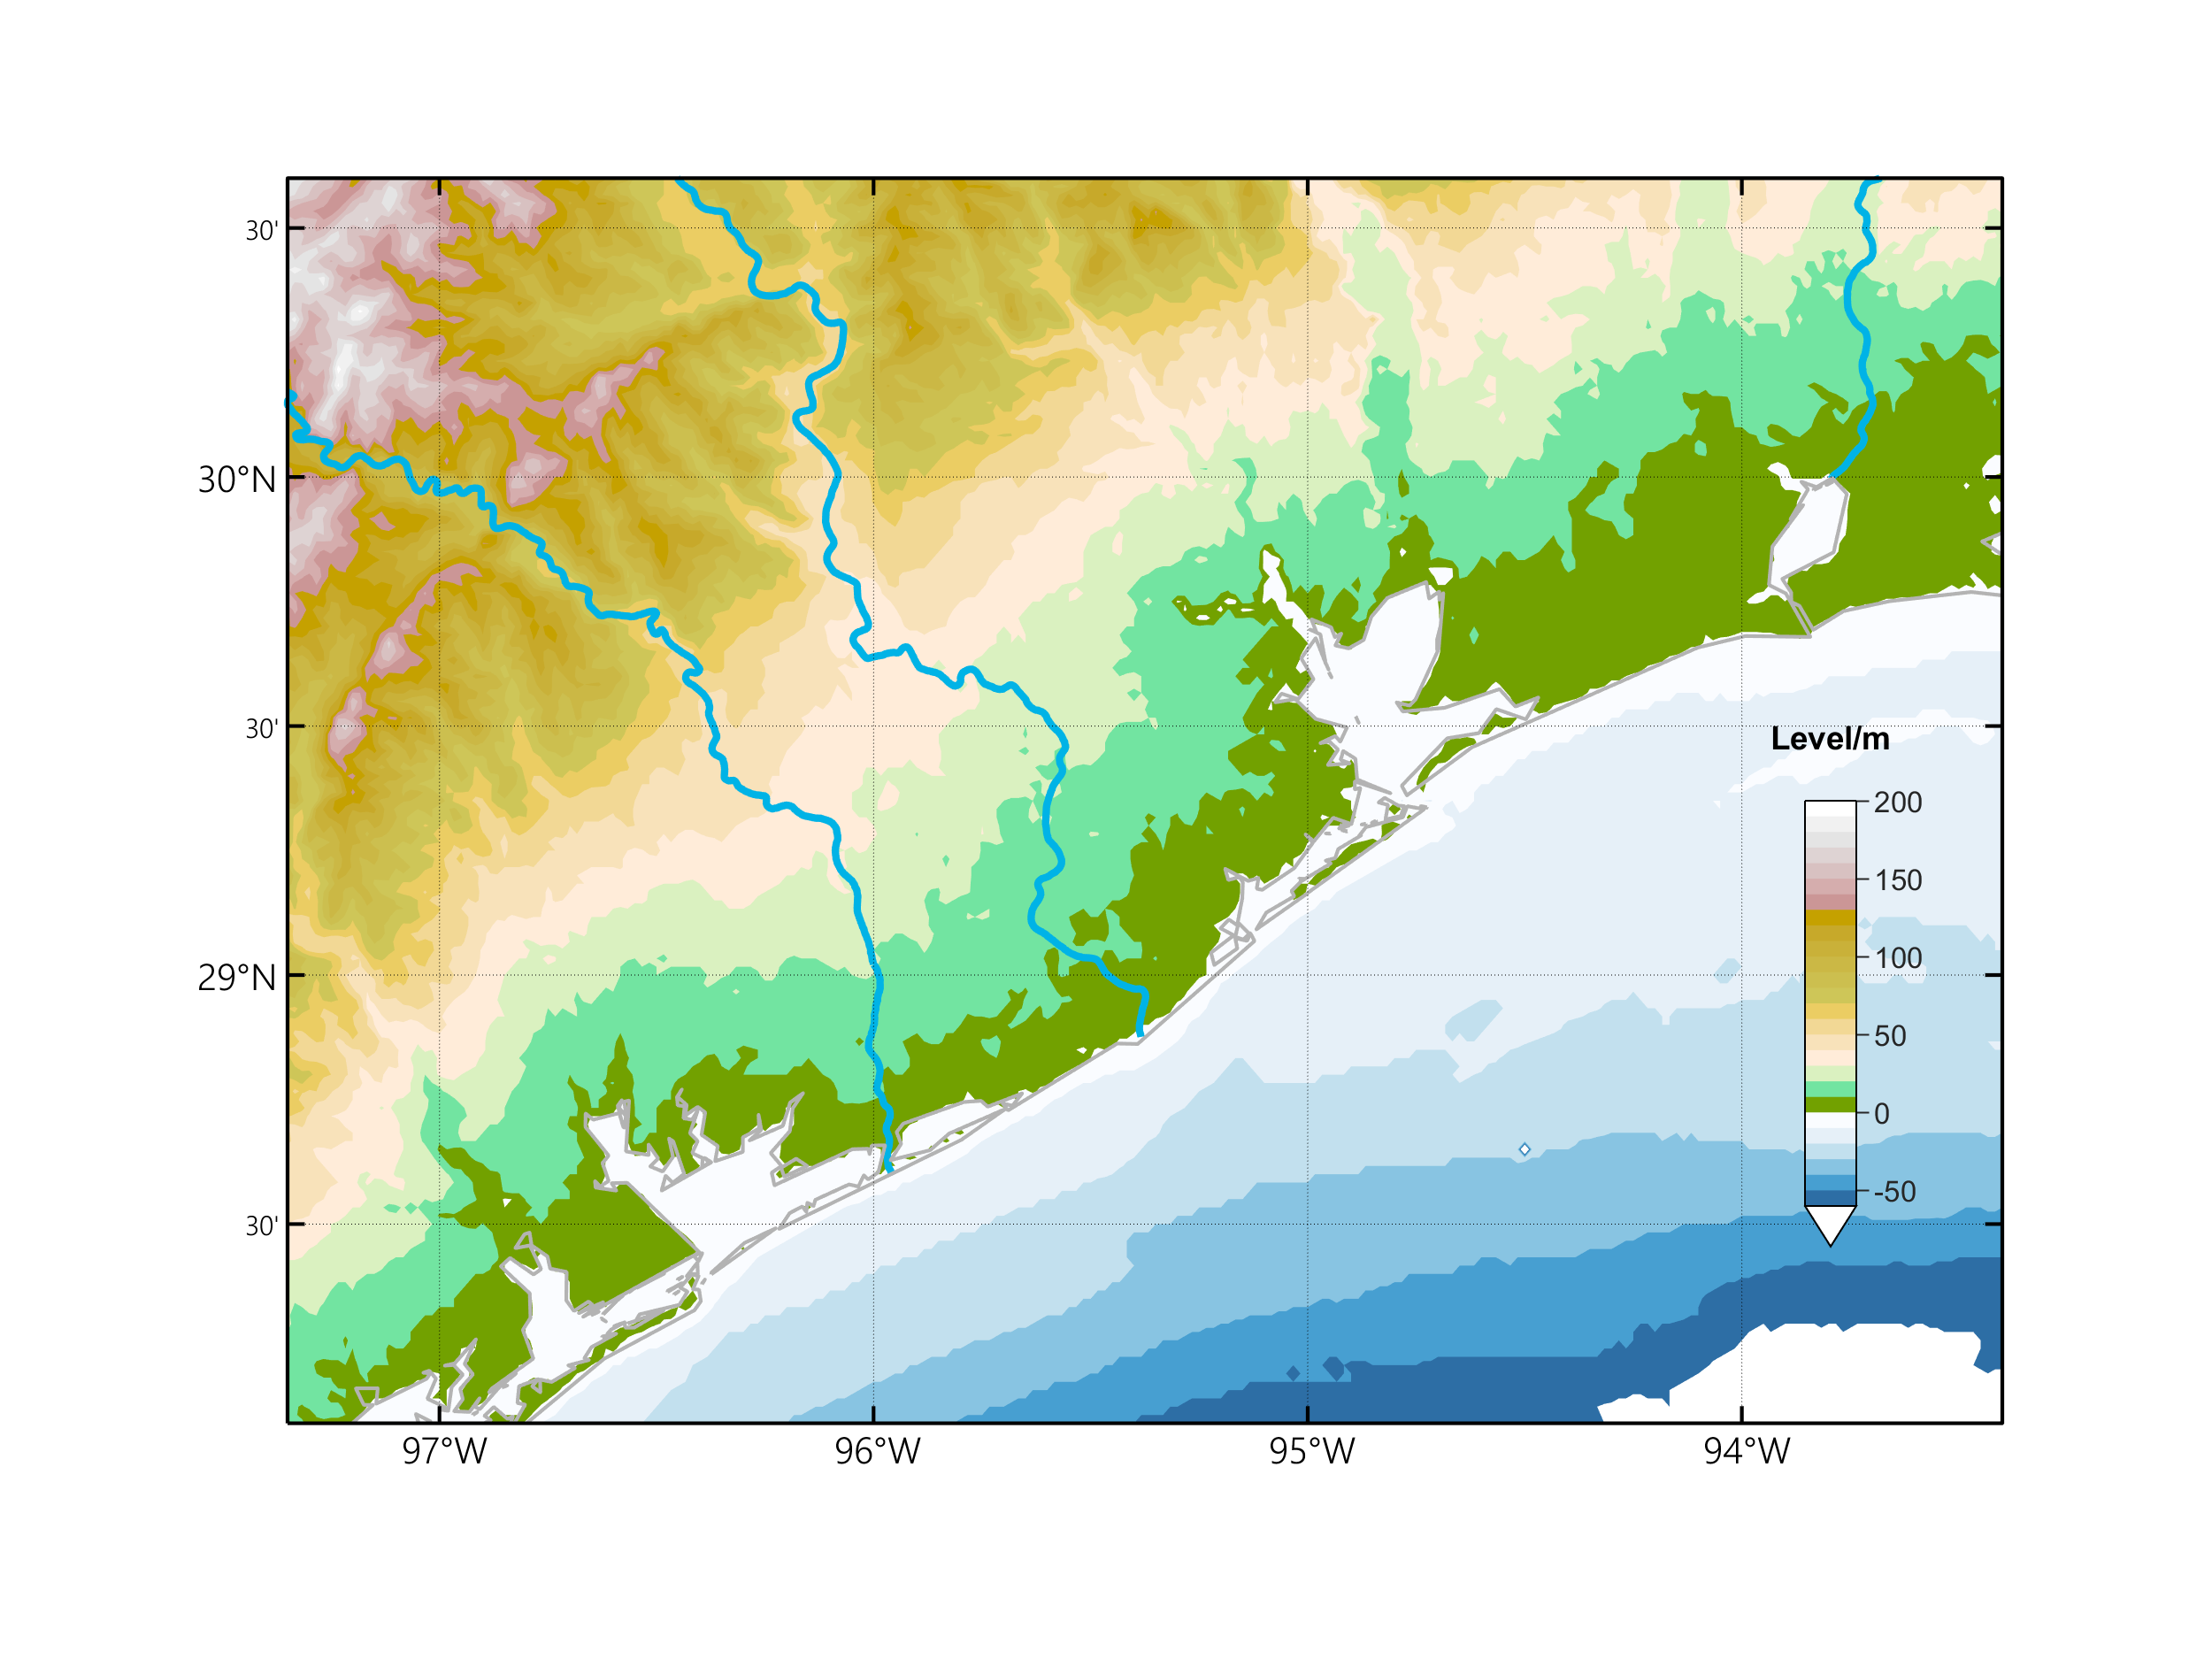 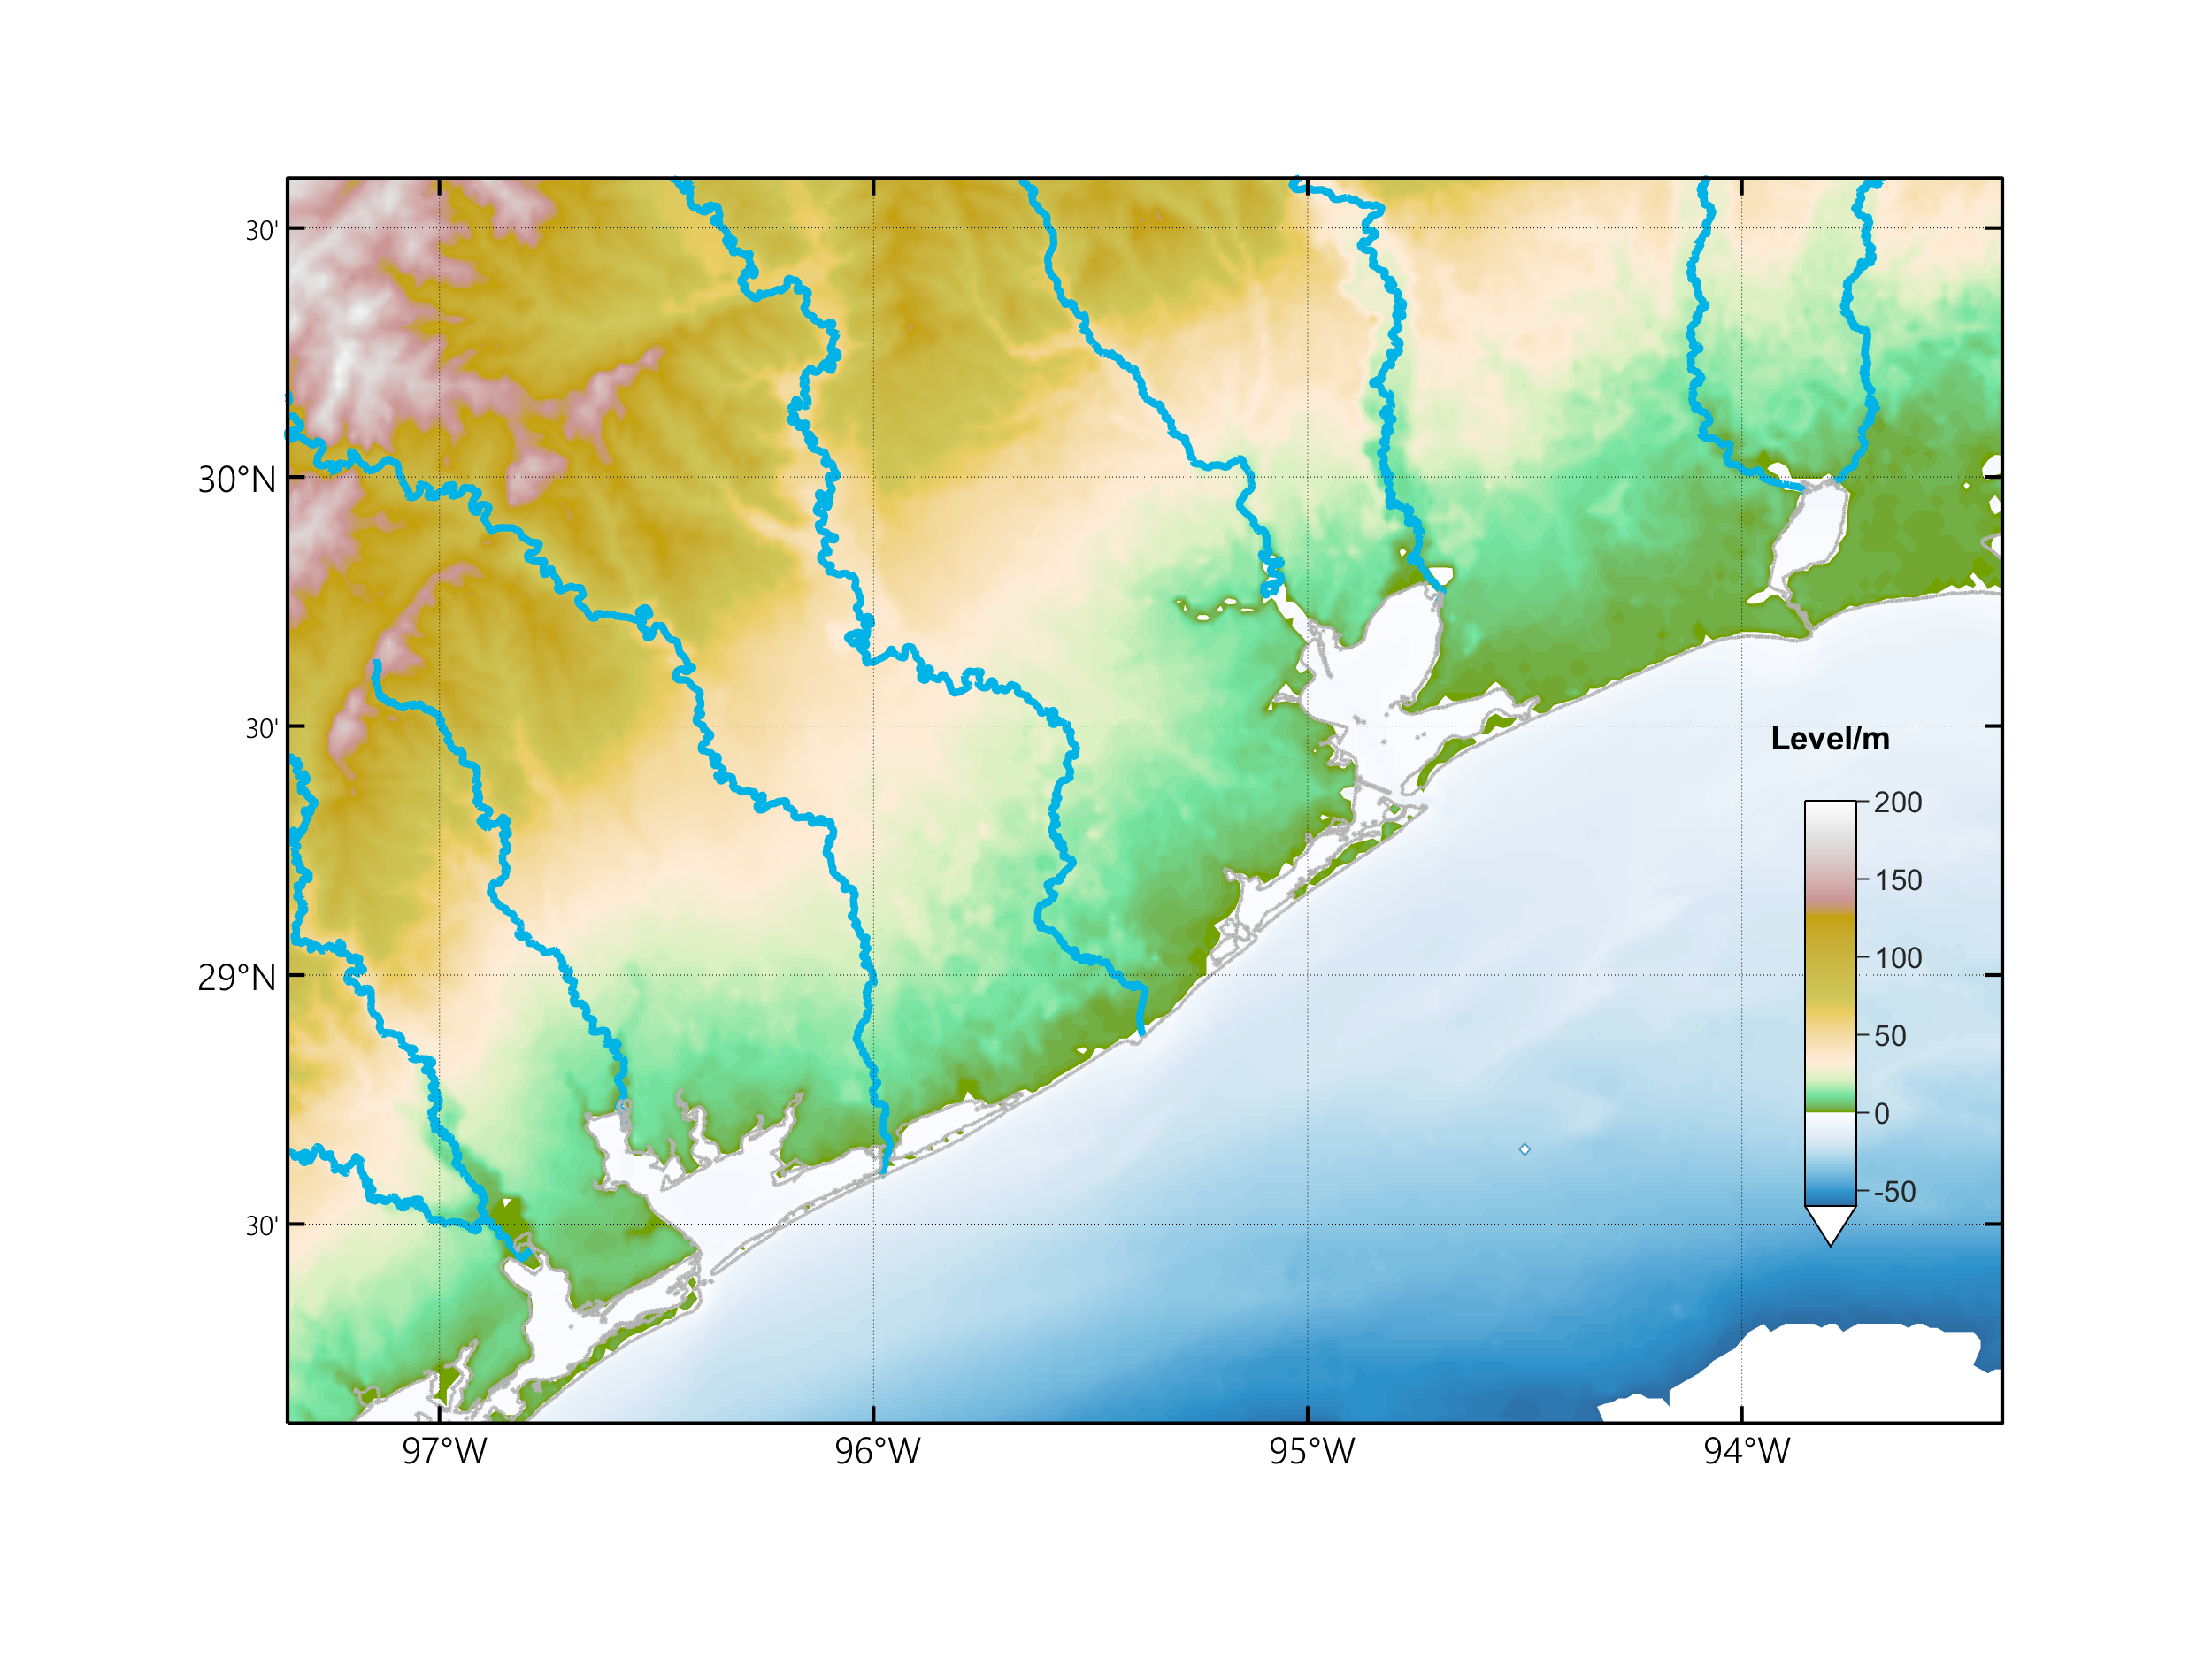 A map (script) that utilizes GSHHG (formerly called GSHHS) for line features (e.g. rivers and coastal lines) and ETOPO1, a 1-minute global topography dataset for contours. See more info about the topological dataset. Addtional script and pdf rendering for higher resolution (second map). |
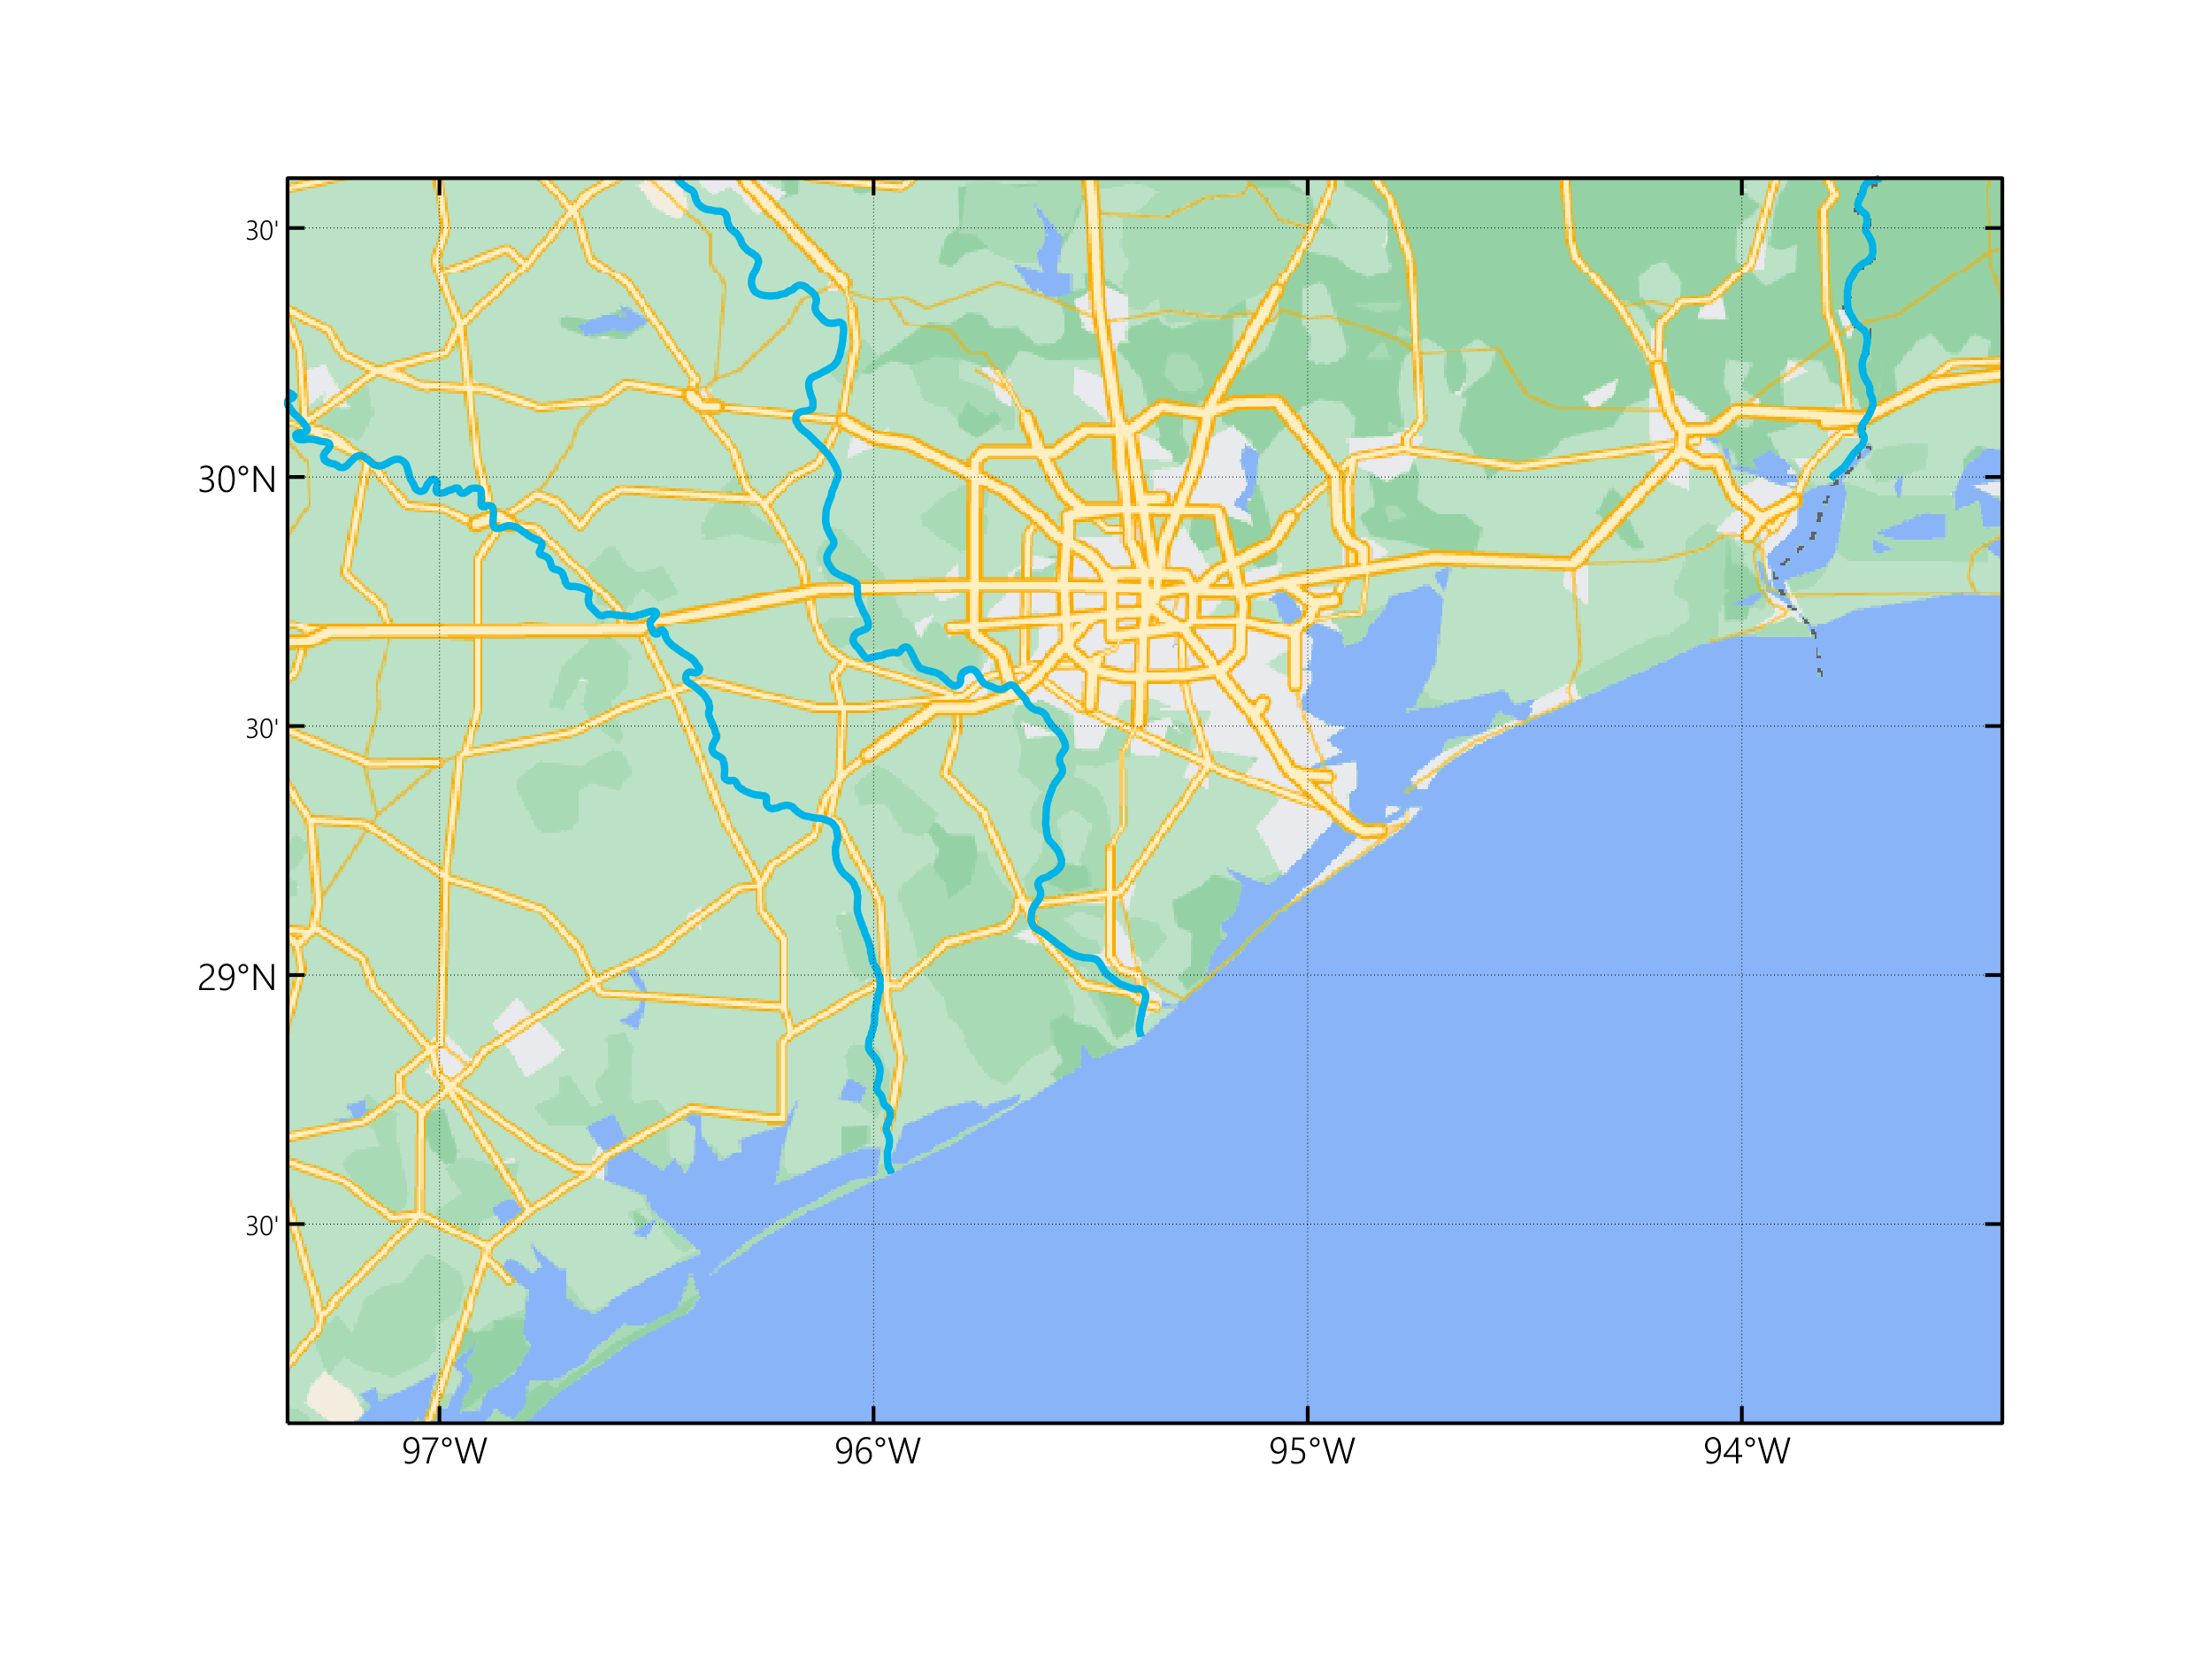 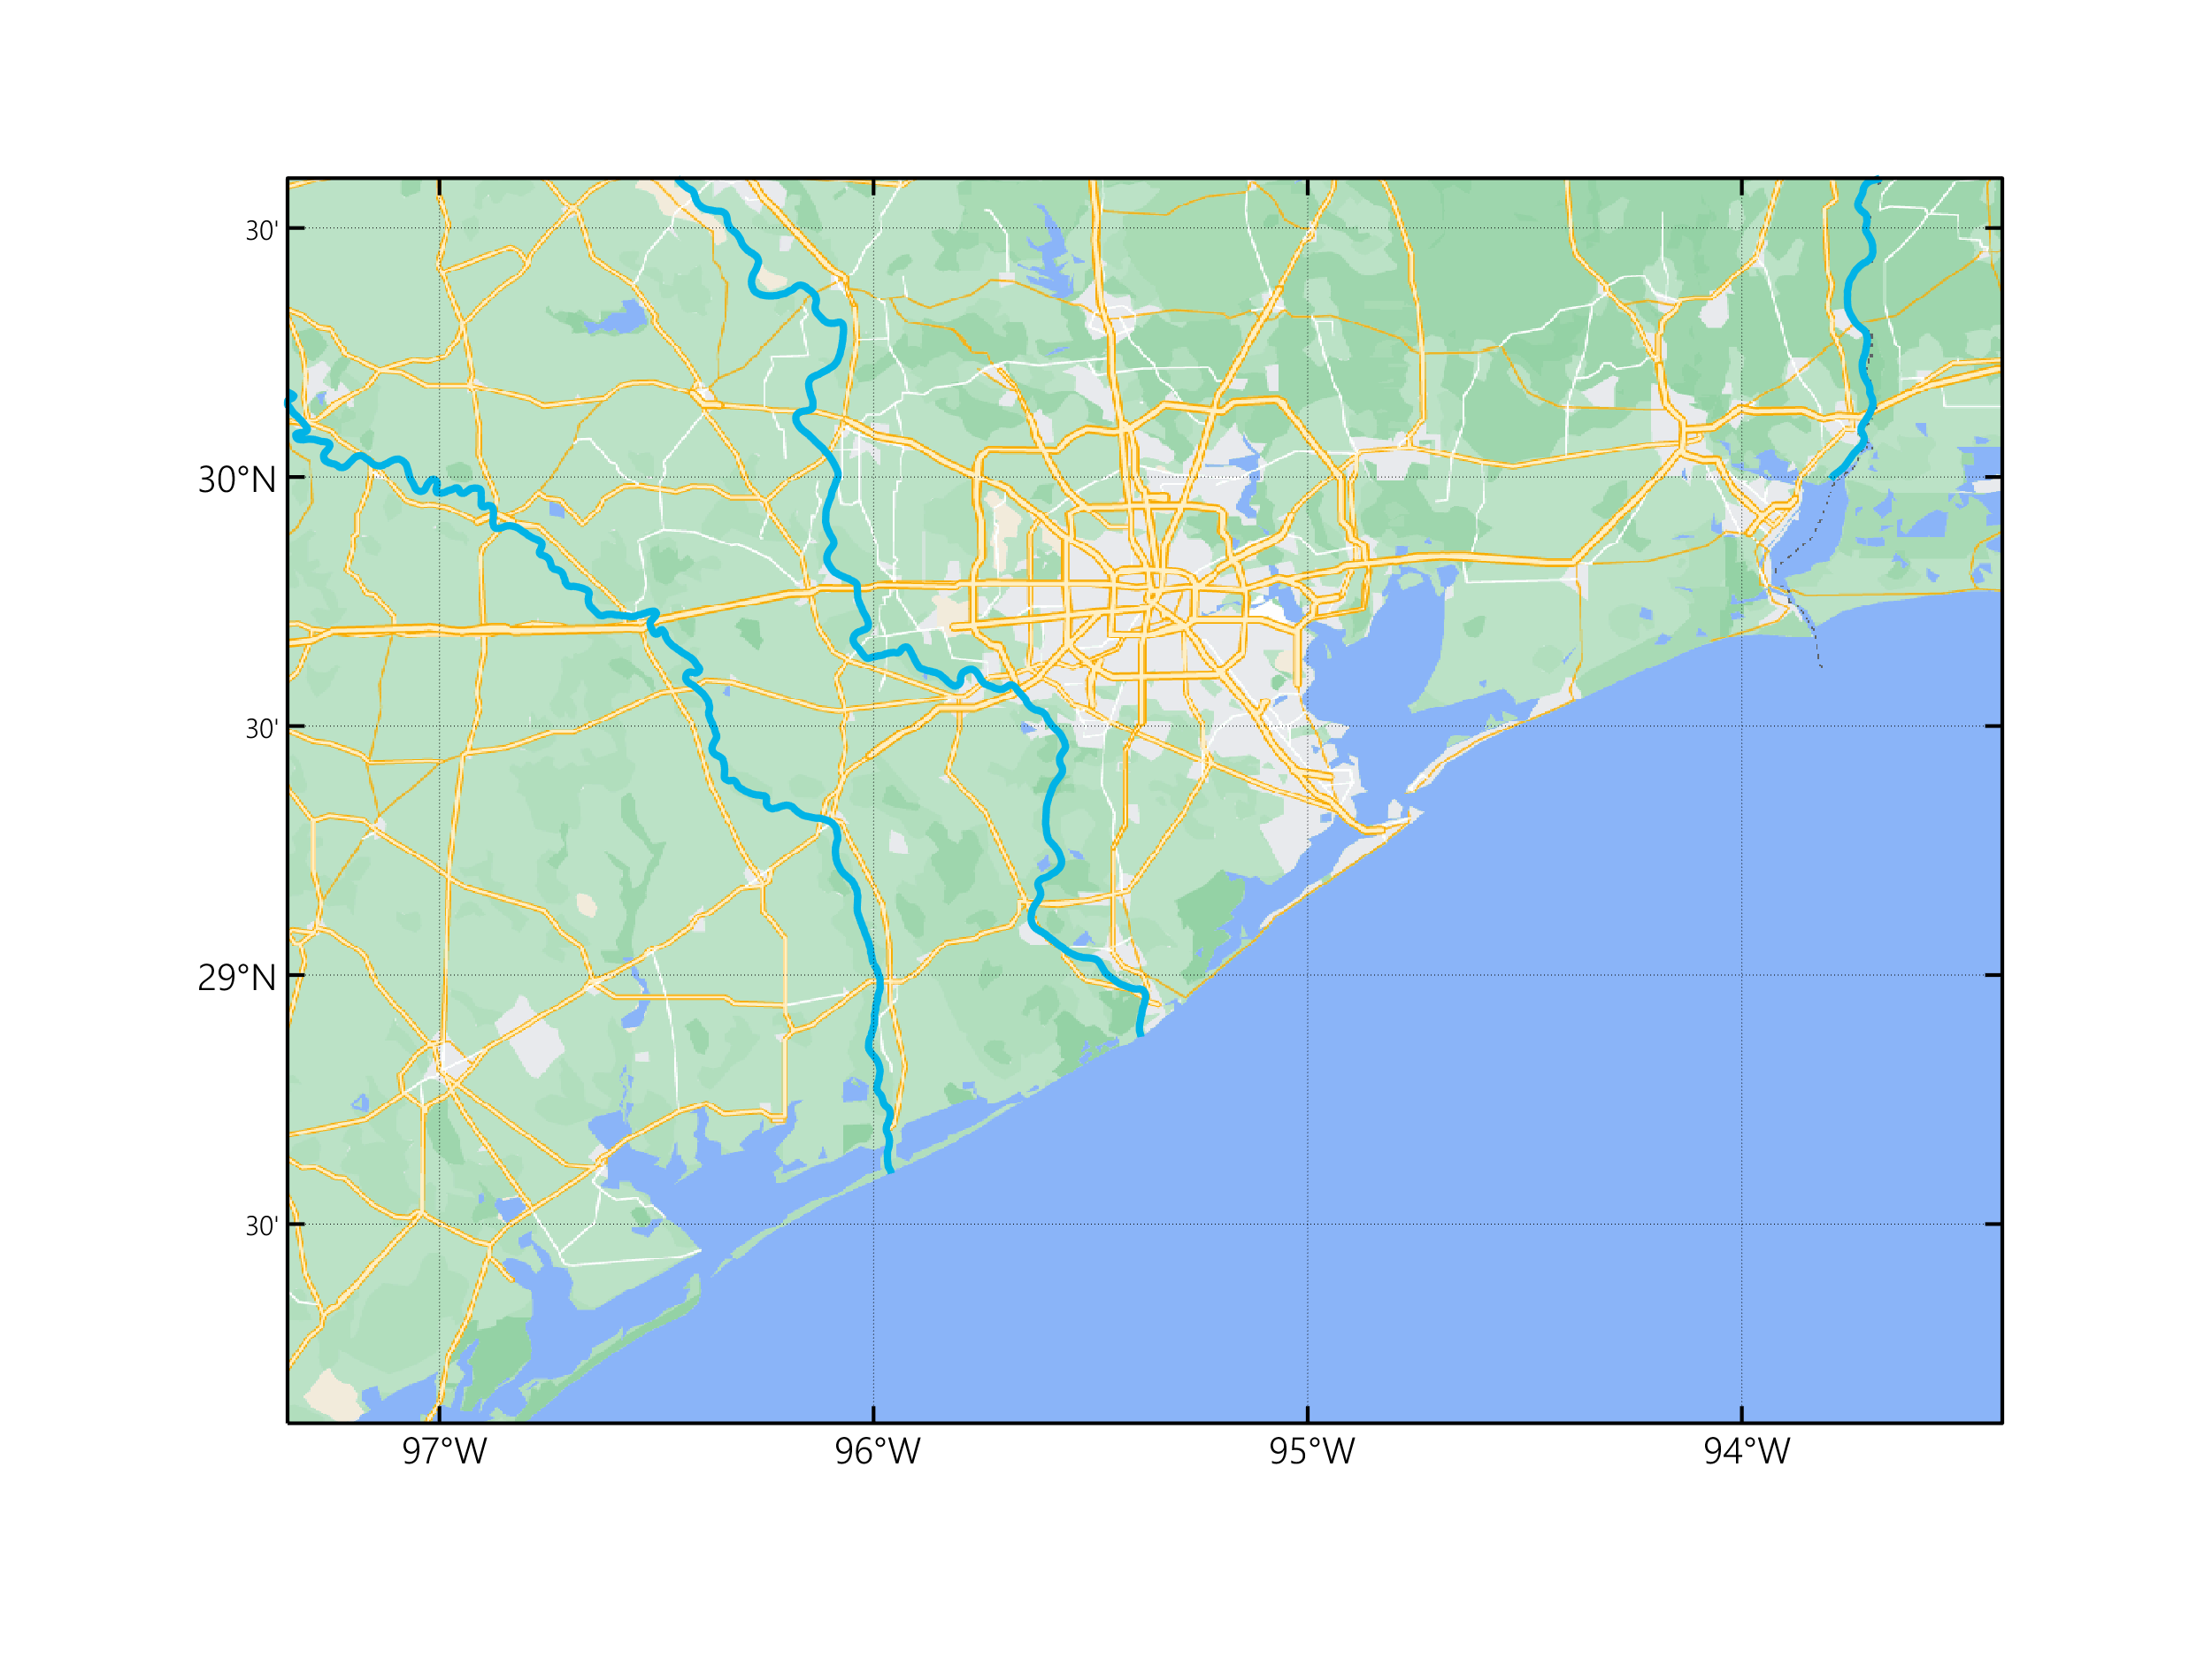 A google-type map (script) that generated using Google Maps API. Script based on plot_google_map. The native resolution (1280X1280) is too low, so I did a little trick to grab four images at the same time and stitch them together to increase resolution and details in the map (second map). |