ArcGIS shapes such as points and polygon, or even raster files can be plotted in Matlab. Here is an example of reading and plotting HUC4 polygons in Matlab.
First step is reading the shape file that’s generated in ArcGIS
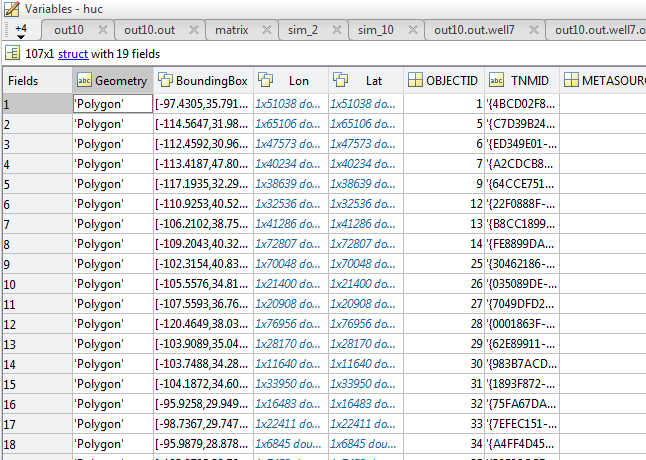
%read in shapefile
huc = shaperead('C:\HUC4.shp','UseGeoCoords', true, 'BoundingBox', [lonlim', latlim']);
then we get a struct like this, in which most of the columns are attribute table variables, with the first few columns showing the geometrical information about each polygon.
Sometimes the vertices are too many for each polygon, which makes the plotting process extremely slow. Here I am using a tool called DecimatePoly to reduce the total number of vertices 10 times less without making noticeable changes on the shape.
Next we will define the color of the polygon by one of the variables in the attribute table using makesymbolspec:
faceColors = makesymbolspec('Polygon',{'INDEX',[1 lenS],'FaceColor',color_att});
%lenS is the number of polygon
%color_att is a 3-column matrix of RGB triplets with length of LenS
Next is to create a map frame to plot on:
ax = usamap(latlim,lonlim); %plot frame using usamap as template
axis off; framem on; gridm on; mlabel on; plabel on;
setm(gca,'MLabelLocation',10) %interval for meridians labeling
setm(gca,'PLabelLocation',5)  %interval for parallels labeling
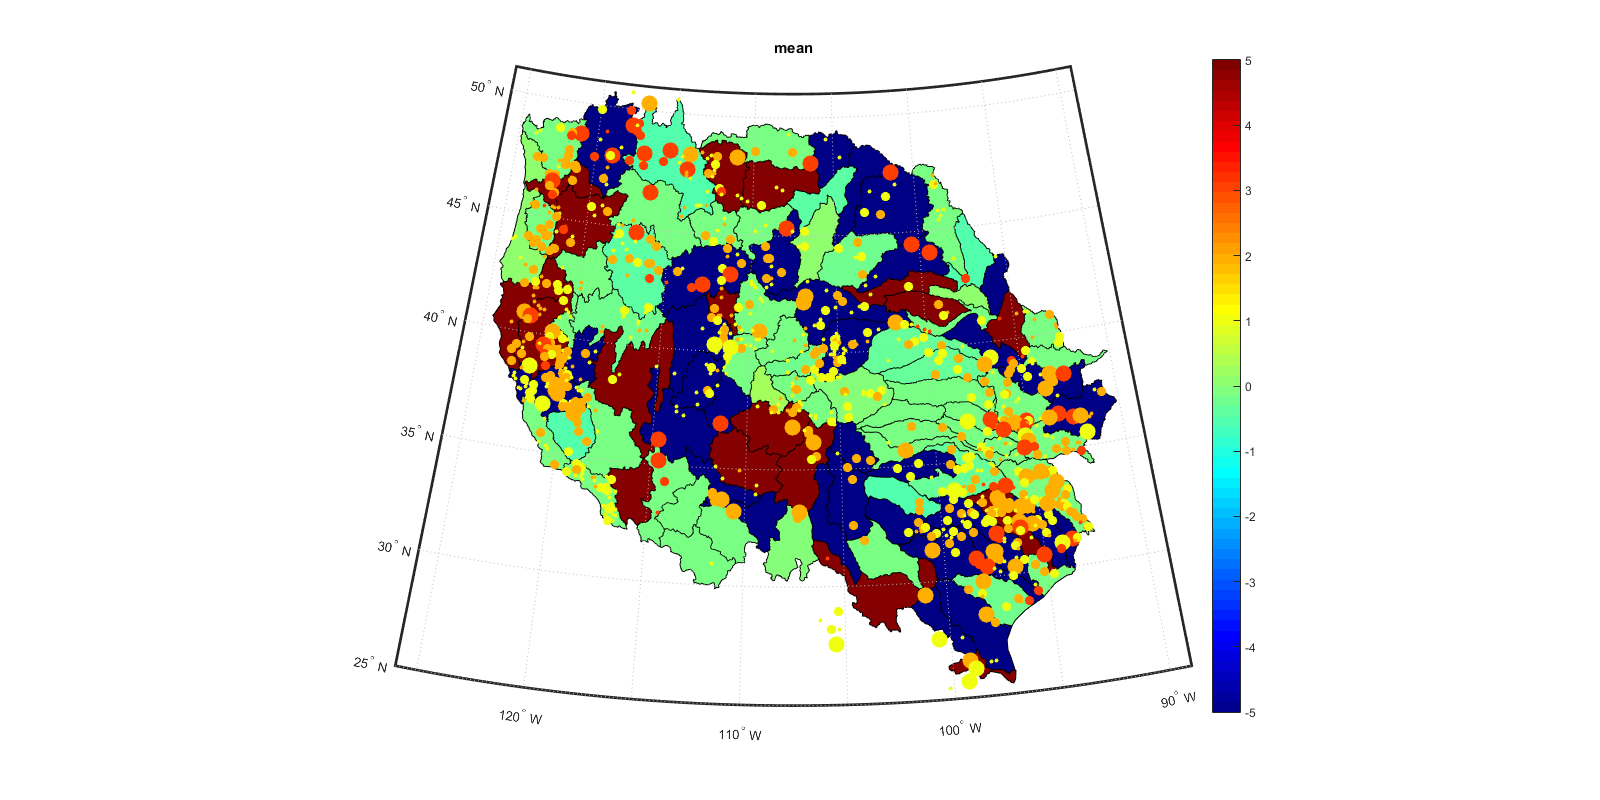
Then plot the polygons
geoshow(ax, huc, 'SymbolSpec', faceColors);
When plotting points on the map, use scatterm
scatterm(lat,lon,s,c,'filled'); % s is vector defines the size of the dots
                                % c is RGB defines the color of the dots
Loading comments...